Reading Refrigerant Density on Pressure-Enthalpy Charts: A Technician's Guide
Learn how to read refrigerant density on pressure-enthalpy charts as temperature changes. Master the lines that show density variations for accurate HVAC diagnostics and system troubleshooting.
AI Summary
A foundational technical guide explaining how to correctly read and interpret refrigerant density on pressure-enthalpy (P-H) charts, a critical skill for accurately verifying system charge and conducting advanced diagnostics.
What set of lines do you follow to see refrigerant density as the temperature increases or decreases?
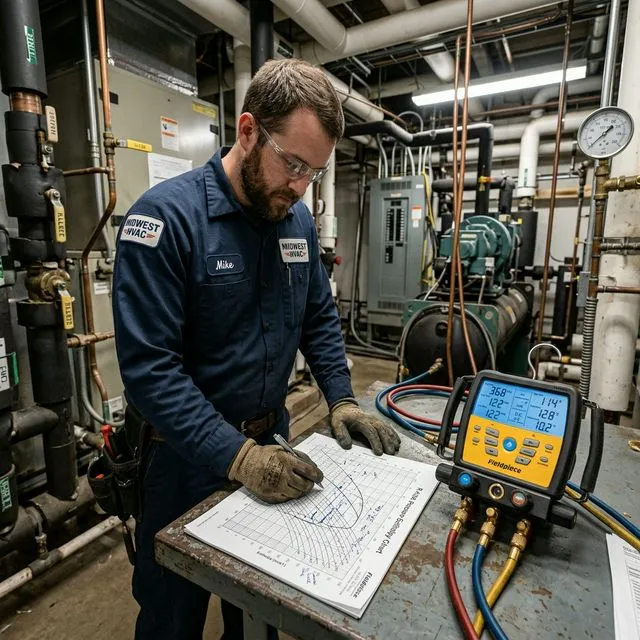
If you’ve ever stared at a pressure-enthalpy (P-H) diagram and wondered where to find density information, you’re not alone. Understanding how refrigerant density changes with temperature is crucial for proper system diagnostics, charge verification, and troubleshooting—but finding that information on the chart isn’t always intuitive.
At ACLogics, we know that mastering these technical fundamentals separates good technicians from great ones. In this guide, we’ll break down exactly which lines to follow on a P-H chart to track density changes, why it matters in the field, and how modern AI tools can help you apply this knowledge faster.
Understanding the Pressure-Enthalpy Chart Basics
Before we dive into density lines, let’s establish what you’re looking at. A pressure-enthalpy chart (also called a P-H diagram) plots refrigerant properties across different conditions. The chart shows:
- Pressure (vertical axis, usually in psia or kPa)
- Enthalpy (horizontal axis, in BTU/lb or kJ/kg)
- Temperature (curved lines across the chart)
- Density (specific volume lines, which we’ll get to)
- Entropy (sometimes shown as additional lines)
The chart is divided into regions: subcooled liquid, saturated liquid, two-phase (vapor-liquid mix), saturated vapor, and superheated vapor. Each region behaves differently, and density changes dramatically as you move between them.
The Key Lines: Specific Volume and Density
Here’s the answer to your question:
To see refrigerant density as temperature increases or decreases, you follow the specific volume (v) lines—also called constant volume lines or isochoric lines.
Specific volume is the inverse of density. Where specific volume is high, density is low. Where specific volume is low, density is high.
On most P-H charts, you’ll see:
- Dashed or dotted lines running diagonally across the chart
- These represent constant specific volume (v) in ft³/lb or m³/kg
- Lower numbers (like v = 0.5 ft³/lb) indicate higher density
- Higher numbers (like v = 5.0 ft³/lb) indicate lower density
How to Read Density Changes
-
As temperature increases at constant pressure:
- Follow a horizontal line (constant pressure) from left to right
- You’ll cross specific volume lines with increasing values
- This means density decreases as temperature rises
-
As temperature decreases at constant pressure:
- Follow the same horizontal line in reverse (right to left)
- You’ll cross specific volume lines with decreasing values
- This means density increases as temperature drops
-
In the two-phase region:
- Density changes dramatically as you move from saturated liquid to saturated vapor
- The specific volume lines are closely spaced here, showing rapid density changes
Why Refrigerant Density Matters in Field Diagnostics
Understanding density isn’t just academic—it’s practical knowledge that helps you:
1. Charge Verification
When checking refrigerant charge, you need to know how much mass is in the system. Density tells you the relationship between volume and mass. If you’re using a sight glass or measuring liquid levels, density helps you understand if you have the right amount of refrigerant.
2. System Performance Analysis
Density affects flow rates, pressure drops, and heat transfer. A system with incorrect density (due to wrong charge or temperature conditions) will show performance issues that might look like other problems.
3. Troubleshooting Low Charge vs. Restriction
Both conditions can show similar symptoms, but understanding density helps you differentiate:
- Low charge: Lower density in the system, less mass circulating
- Restriction: Density may be normal, but flow is restricted
4. Proper Refrigerant Recovery
When recovering refrigerant, knowing density helps you estimate how much you’ll collect and ensures you’re using the right recovery tank size.
Practical Example: Reading R-410A Density
Let’s walk through a real-world example using R-410A:
Scenario: You’re checking a system operating at 120°F condensing temperature and 40°F evaporating temperature.
-
Find your operating points on the P-H chart:
- Condensing pressure: ~417 psia at 120°F
- Evaporating pressure: ~118 psia at 40°F
-
Locate the specific volume lines:
- At the condenser outlet (subcooled liquid): v ≈ 0.013 ft³/lb → Density ≈ 77 lb/ft³ (very high)
- At the evaporator inlet (two-phase): v ≈ 0.5 ft³/lb → Density ≈ 2 lb/ft³ (much lower)
- At the evaporator outlet (superheated vapor): v ≈ 1.2 ft³/lb → Density ≈ 0.83 lb/ft³ (lowest)
-
What this tells you:
- The refrigerant is much denser as a liquid than as a vapor
- This density difference is what drives the refrigeration cycle
- If your readings don’t match expected density values, you may have a charge or system issue
Common Mistakes When Reading Density
Even experienced technicians can make these errors:
❌ Confusing Temperature Lines with Density Lines
Temperature lines (isotherms) curve across the chart, but they don’t directly show density. You need to see where temperature lines intersect with specific volume lines.
❌ Not Accounting for Pressure
Density changes with both temperature AND pressure. Always check both when reading the chart.
❌ Ignoring the Phase Region
Density behaves very differently in liquid vs. vapor vs. two-phase regions. Make sure you know which region your operating point is in.
❌ Using the Wrong Chart
Different refrigerants have different P-H charts. R-410A, R-134a, and R-22 all have unique properties. Always use the correct chart for the refrigerant you’re working with.
How AI Tools Can Help with Density Calculations
While understanding P-H charts is essential, modern HVAC AI diagnostic tools could help you apply this knowledge faster in the field.
Would you like to see automatic density calculation features in ACLogics? This could include:
- Automatic density calculations from your pressure and temperature readings
- Comparison of your readings to expected values for the refrigerant type
- Anomaly detection when density doesn’t match expected conditions
- Clear explanations of the relationship between density, charge, and system performance
Instead of manually reading the chart every time, you could input your measurements and get instant density calculations with context about what they mean for your specific system.
Quick Reference: Density Reading Checklist
When working with refrigerant density:
✅ Identify the refrigerant type (R-410A, R-134a, R-22, etc.)
✅ Locate your operating point on the P-H chart (pressure + temperature)
✅ Find the nearest specific volume line (v in ft³/lb or m³/kg)
✅ Calculate density (density = 1 / specific volume)
✅ Compare to expected values for your system conditions
✅ Consider the phase region (liquid, vapor, or two-phase)
✅ Verify with system measurements (pressure, temperature, superheat, subcooling)
The Bottom Line
To see refrigerant density as temperature increases or decreases, follow the specific volume (v) lines on your pressure-enthalpy chart. These lines show you how density changes across different conditions, helping you verify charge, diagnose problems, and understand system behavior.
Mastering P-H chart reading is a fundamental skill, but you don’t have to do it alone. Modern AI diagnostic tools can help you apply this knowledge faster, reducing calculation time and improving accuracy in the field.
Ready to Master Refrigerant Diagnostics?
Understanding density is just one piece of the diagnostic puzzle. The ACLogics can guide you through complex refrigerant calculations, system analysis, and troubleshooting—all while helping you understand the “why” behind the numbers.
Try ACLogics to see how AI can enhance your diagnostic workflow, or contact us to learn more about our tools for HVAC professionals.
Key Takeaways
- Specific volume lines (v) on P-H charts show density changes
- Density decreases as temperature increases at constant pressure
- Density increases as temperature decreases at constant pressure
- Understanding density helps with charge verification, performance analysis, and troubleshooting
- AI diagnostic tools can calculate density automatically from field measurements
- Always use the correct P-H chart for your specific refrigerant type